The Human Ear
Hearing is the perception of sound. (Perception is commonly defined to be awareness through the senses, a typically circular definition of higher-level processes in living organisms.) Normal human hearing encompasses frequencies from 20 to 20,000 Hz, an impressive range. Sounds below 20 Hz are called infrasound, whereas those above 20,000 Hz are ultrasound. Neither is perceived by the ear, although infrasound can sometimes be felt as vibrations. When we do hear low-frequency vibrations, such as the sounds of a diving board, we hear the individual vibrations only because there are higher-frequency sounds in each. Other animals have hearing ranges different from that of humans. Dogs can hear sounds as high as 30,000 Hz, whereas bats and dolphins can hear up to 100,000-Hz sounds. You may have noticed that dogs respond to the sound of a dog whistle which produces sound out of the range of human hearing. Elephants are known to respond to frequencies below 20 Hz.
The perception of frequency is called pitch. Most of us have excellent relative pitch, which means that we can tell whether one sound has a different frequency from another. Typically, we can discriminate between two sounds if their frequencies differ by 0.3% or more. For example, 500.0 and 501.5 Hz are noticeably different. Pitch perception is directly related to frequency and is not greatly affected by other physical quantities such as intensity. Musical notes are particular sounds that can be produced by most instruments and in Western music have particular names. Combinations of notes constitute music. Some people can identify musical notes, such as A-sharp, C, or E-flat, just by listening to them. This uncommon ability is called perfect pitch.
The ear is remarkably sensitive to low-intensity sounds. The lowest audible intensity or threshold is about 10−12 W/m2 or 0 dB. Sounds as much as 1012 more intense can be briefly tolerated. Very few measuring devices are capable of observations over a range of a trillion. The perception of intensity is called loudness. At a given frequency, it is possible to discern differences of about 1 dB, and a change of 3 dB is easily noticed. But loudness is not related to intensity alone. Frequency has a major effect on how loud a sound seems. The ear has its maximum sensitivity to frequencies in the range of 2000 to 5000 Hz, so that sounds in this range are perceived as being louder than, say, those at 500 or 10,000 Hz, even when they all have the same intensity. Sounds near the high- and low-frequency extremes of the hearing range seem even less loud, because the ear is even less sensitive at those frequencies. Table 1 gives the dependence of certain human hearing perceptions on physical quantities.
| Sound Perceptions | |
|---|---|
| Perception | Physical quantity |
| Pitch | Frequency |
| Loudness | Intensity and Frequency |
| Timbre | Number and relative intensity of multiple frequencies. Subtle craftsmanship leads to non-linear effects and more detail. |
| Note | Basic unit of music with specific names, combined to generate tunes |
| Tone | Number and relative intensity of multiple frequencies. |
A unit called a phon is used to express loudness numerically. Phons differ from decibels because the phon is a unit of loudness perception, whereas the decibel is a unit of physical intensity. Figure 2 shows the relationship of loudness to intensity (or intensity level) and frequency for persons with normal hearing. The curved lines are equal-loudness curves. Each curve is labeled with its loudness in phons. Any sound along a given curve will be perceived as equally loud by the average person. The curves were determined by having large numbers of people compare the loudness of sounds at different frequencies and sound intensity levels. At a frequency of 1000 Hz, phons are taken to be numerically equal to decibels. The following example helps illustrate how to use the graph:

Figure 2. The relationship of loudness in
phons to intensity level (in decibels) and intensity (in watts per meter
squared) for persons with normal hearing. The curved lines are
equal-loudness curves—all sounds on a given curve are perceived as
equally loud. Phons and decibels are defined to be the same at 1000 Hz.
Example 1. Measuring Loudness: Loudness Versus Intensity Level and Frequency
- What is the loudness in phons of a 100-Hz sound that has an intensity level of 80 dB?
- What is the intensity level in decibels of a 4000-Hz sound having a loudness of 70 phons?
- At what intensity level will an 8000-Hz sound have the same loudness as a 200-Hz sound at 60 dB?
Strategy for Part 1
The graph in Figure 2 should be referenced in order to solve this example. To find the loudness of a given sound, you must know its frequency and intensity level and locate that point on the square grid, then interpolate between loudness curves to get the loudness in phons.Solution for Part 1
Identify knowns:- The square grid of the graph relating phons and decibels is a plot of intensity level versus frequency—both physical quantities.
- 100 Hz at 80 dB lies halfway between the curves marked 70 and 80 phons.
Strategy for Part 2
The graph in Figure 2 should be referenced in order to solve this example. To find the intensity level of a sound, you must have its frequency and loudness. Once that point is located, the intensity level can be determined from the vertical axis.Solution for Part 2
Identify knowns; Values are given to be 4000 Hz at 70 phons.Follow the 70-phon curve until it reaches 4000 Hz. At that point, it is below the 70 dB line at about 67 dB.
Find the intensity level: 67 dB
Strategy for Part 3
The graph in Figure 2 should be referenced in order to solve this example.Solution for Part 3
Locate the point for a 200 Hz and 60 dB sound. Find the loudness: This point lies just slightly above the 50-phon curve, and so its loudness is 51 phons. Look for the 51-phon level is at 8000 Hz: 63 dB.Discussion
These answers, like all information extracted from Figure 2, have uncertainties of several phons or several decibels, partly due to difficulties in interpolation, but mostly related to uncertainties in the equal-loudness curves.We do not often utilize our full range of hearing. This is particularly true for frequencies above 8000 Hz, which are rare in the environment and are unnecessary for understanding conversation or appreciating music. In fact, people who have lost the ability to hear such high frequencies are usually unaware of their loss until tested. The shaded region in Figure 3 is the frequency and intensity region where most conversational sounds fall. The curved lines indicate what effect hearing losses of 40 and 60 phons will have. A 40-phon hearing loss at all frequencies still allows a person to understand conversation, although it will seem very quiet. A person with a 60-phon loss at all frequencies will hear only the lowest frequencies and will not be able to understand speech unless it is much louder than normal. Even so, speech may seem indistinct, because higher frequencies are not as well perceived. The conversational speech region also has a gender component, in that female voices are usually characterized by higher frequencies. So the person with a 60-phon hearing impediment might have difficulty understanding the normal conversation of a woman.

Figure 3. The shaded region represents
frequencies and intensity levels found in normal conversational speech.
The 0-phon line represents the normal hearing threshold, while those at
40 and 60 represent thresholds for people with 40- and 60-phon hearing
losses, respectively.
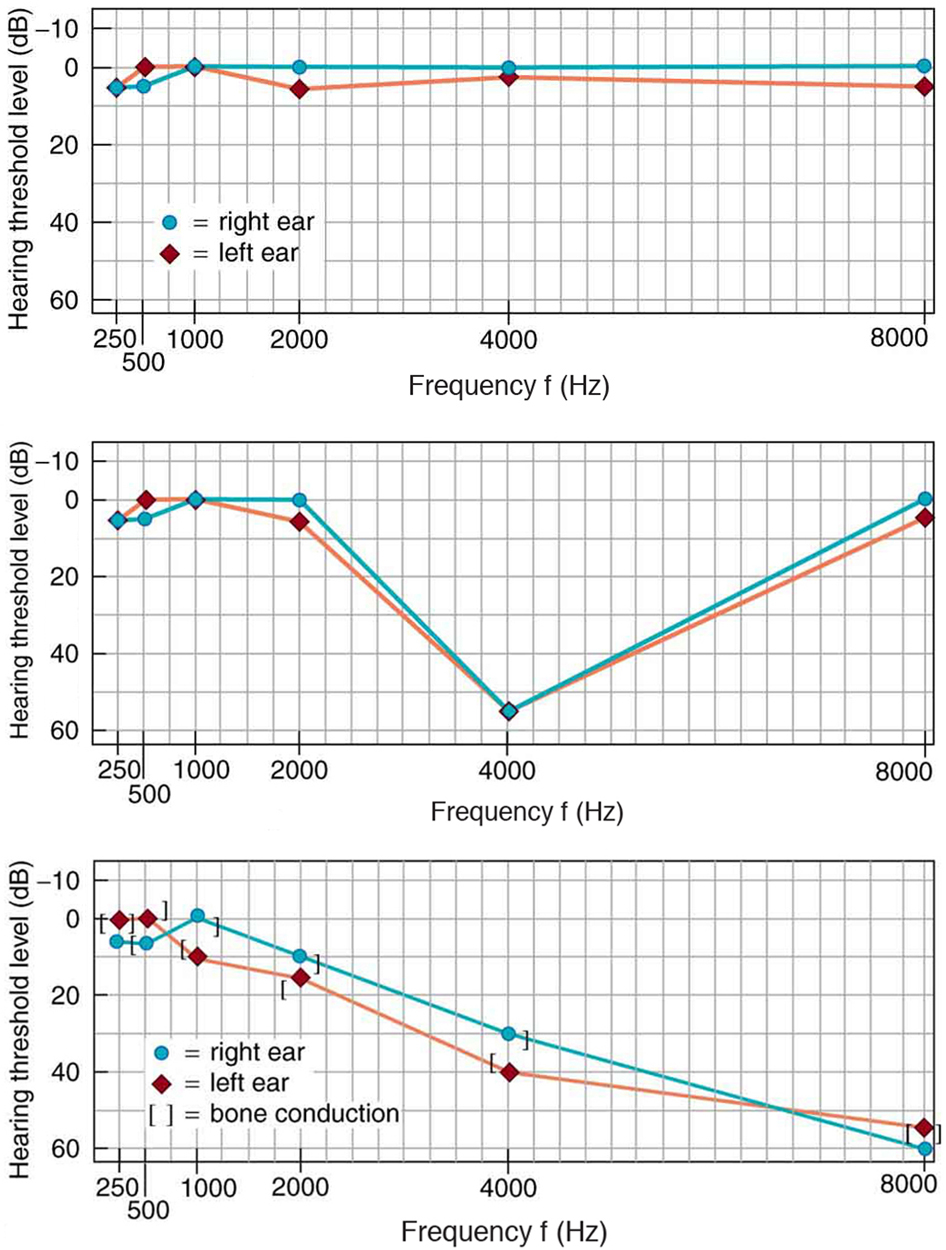
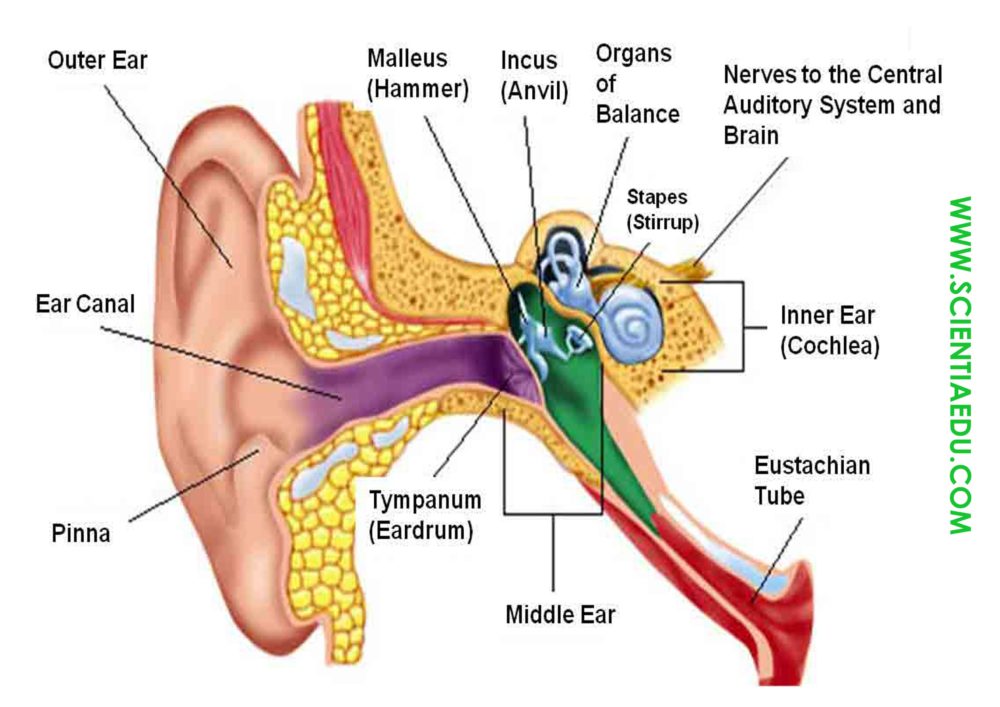
Figure 4. Audiograms showing the threshold in
intensity level versus frequency for three different individuals.
Intensity level is measured relative to the normal threshold. The top
left graph is that of a person with normal hearing. The graph to its
right has a dip at 4000 Hz and is that of a child who suffered hearing
loss due to a cap gun. The third graph is typical of presbycusis, the
progressive loss of higher frequency hearing with age. Tests performed
by bone conduction (brackets) can distinguish nerve damage from middle
ear damage.
The Hearing Mechanism
The hearing mechanism involves some interesting physics. The sound wave that impinges upon our ear is a pressure wave. The ear is a transducer that converts sound waves into electrical nerve impulses in a manner much more sophisticated than, but analogous to, a microphone. Figure 5 shows the gross anatomy of the ear with its division into three parts: the outer ear or ear canal; the middle ear, which runs from the eardrum to the cochlea; and the inner ear, which is the cochlea itself. The body part normally referred to as the ear is technically called the pinna.
Figure 5. The illustration shows the gross anatomy of the human ear.

Figure 6. This schematic shows the middle
ear’s system for converting sound pressure into force, increasing that
force through a lever system, and applying the increased force to a
small area of the cochlea, thereby creating a pressure about 40 times
that in the original sound wave. A protective muscle reaction to intense
sounds greatly reduces the mechanical advantage of the lever system.

Figure 7. The inner ear, or cochlea,
is a
coiled tube about 3 mm in diameter and 3 cm in length if uncoiled. When
the oval window is forced inward, as shown, a pressure wave travels
through the perilymph in the direction of the arrows, stimulating nerves
at the base of cilia in the organ of Corti.
The cochlear implant was pioneered in Melbourne, Australia, by Graeme Clark in the 1970s for his deaf father. The implant consists of three external components and two internal components. The external components are a microphone for picking up sound and converting it into an electrical signal, a speech processor to select certain frequencies and a transmitter to transfer the signal to the internal components through electromagnetic induction. The internal components consist of a receiver/transmitter secured in the bone beneath the skin, which converts the signals into electric impulses and sends them through an internal cable to the cochlea and an array of about 24 electrodes wound through the cochlea. These electrodes in turn send the impulses directly into the brain. The electrodes basically emulate the cilia.
EmoticonEmoticon